The Historical Maps page lets you explore every election in U.S. history. You select the election year with the year slider, and the map, legend, and categories will be updated. An interesting thing to try is starting at the first election, 1788, and slowly scrolling through history to the most recent election, 2020. You can get an idea of how the country has changed politically by watching the states change color. You can pinch-zoom and pan around the map just as you can in other pages. Here’s the map from the 1960 election.
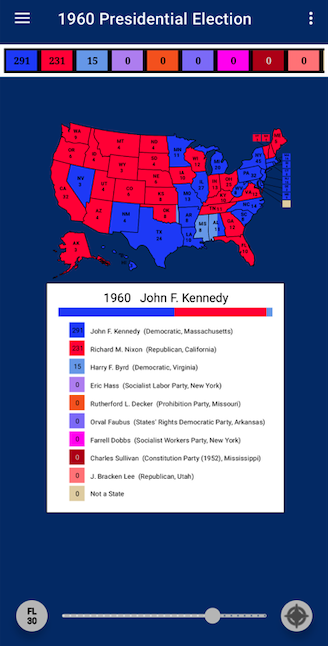
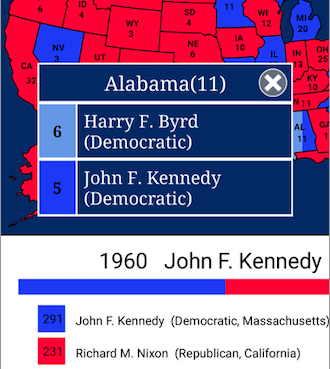
The legend shows the winner and the electoral counts for each candidate. Tapping on a state will show you how the electoral votes where distributed for that state. You might be surprised that not all states allocate all their electoral votes to a single candidate. For example, here’s Alabama in 1960.
These colored squares

represent the categories, which are usually the candidates, but in some maps, might be a special value such as “Not a State” or “Not Ratified Constitution”. The category list is scrollable in case there are too many categories for the screen to display at once. Tapping on a category will present an information dialog with two tabs. One tab contains the detailed electoral vote breakdown
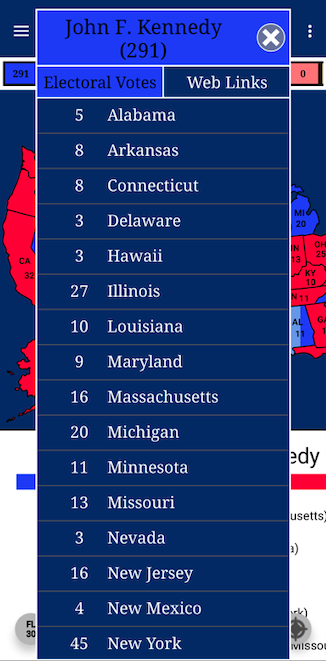
and the other contains informative links related the candidate, the election, and the party.
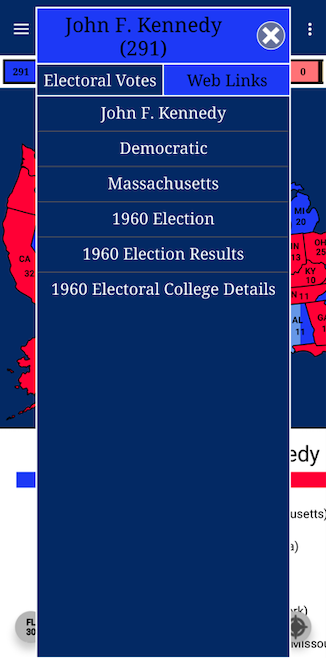
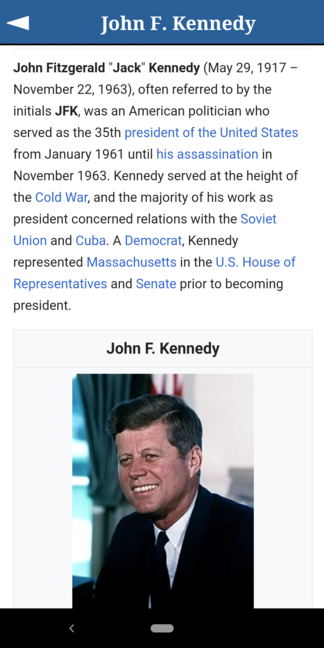
For example, tapping “John F. Kennedy” in the dialog above would take you to the Wikipedia page about JFK.