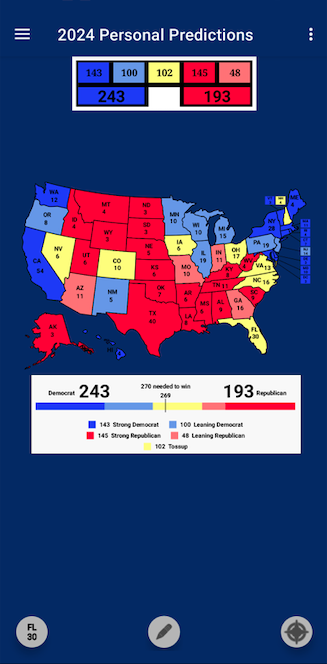
The primary purpose of U.S. 270 is to allow you to explore electoral college possibilities. The “Personal Predictions” page lets you assign categories to each state or, for the few states that allow splitting their electoral votes, to assign categories to different areas of a single state. The categories are automatically tallied and displayed in a legend below the map. Open the menu and select “Personal Predictions”.
The screen contains an election palette that looks like this.
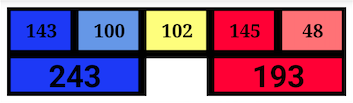
Total Democratic (243) = Strong Democratic (143) + Leaning Democratic (100)
Total Republican (193) = Strong Republican (145) + Leaning Republican (48)
Tossup 102
Blue sections represent electoral votes assigned to the Democratic candidate, Red sections represent electoral votes assigned to the Republican candidate, and the Yellow section represents Tossup electoral votes. The Blue and Red sections are broken into subcategories: Strong and Leaning.
Edit Mode
To change the map, you must first select Edit Mode by tapping the Pencil icon at the bottom of the screen.

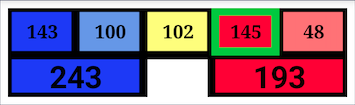
In Edit Mode the icon will turn the color of the current category selection:

And the currently selected palette category will have a green border, like this:
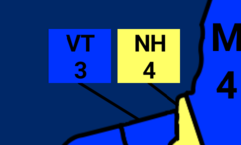
Editing Small States
You might need to pinch-zoom and pan around the map to select some of the smaller states. Also, there are small squares off to the sides of the smaller states that can be selected to change their categories such as these for Vermont and New Hampshire:
After pinch-zooming/panning, you can press the compass button (shown below) in the lower right corner to reset the map back to its original position:

Splitting Electoral Votes
Currently, two states, Nebraska and Maine, allow their electoral votes to be divided, that is, they are not winner-take-all states. When you select these states, you’ll see a dialog like this:
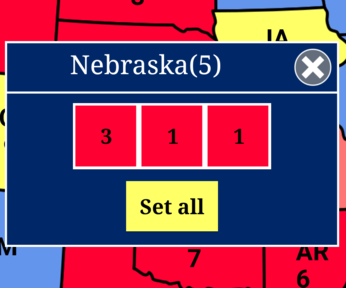
which allows you to assign different categories to the different areas of the state. You can also use the “Set All” button here to assign the current category to all areas of the state.
Toggle State Names and Electoral Vote Values
In the lower left corner, you’ll see this button:

Tap it and you can change the display mode of the map to one of these:
- Show state abbreviations and electoral vote values
- Show only state abbreviations
- Show only electoral vote value
- Show nothing, no abbreviations or electoral vote values
Legend
Below the map is a legend showing the current breakdown of your category assignments.
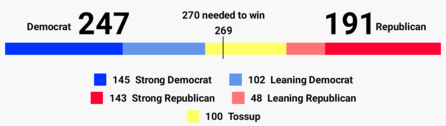
It might be easier to visualize your predictions by looking at the legend rather the counts in the palette.
Reset Map
If you want to reset your predictions to the default values or to all tossup values, simple press the “Reset Map” option from the menu in the upper right corner.
Change Titles
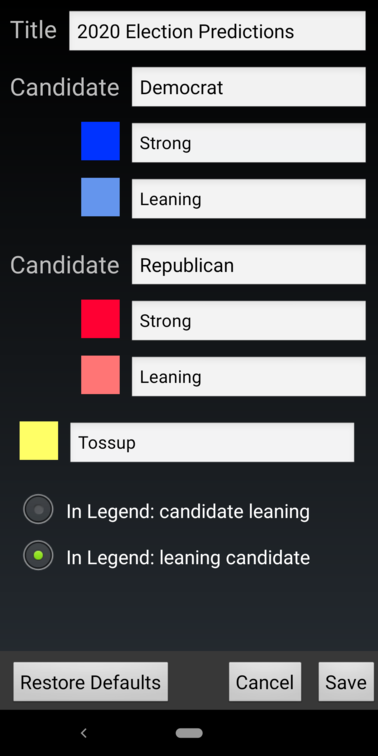
The default title of the map is
- 2024 Election Predictions
The default titles for candidates are
- Democrat
- Republican
- Tossup
And the default titles for subcategories are
- Strong
- Leaning
You can change these if you want. Just press the “Change Titles” option from the menu in the upper right corner, and you’ll see this dialog.
Sharing a Snapshot of Your Predictions Map
Open the menu in the upper right corner, and press the “Share Snapshot” option to share a snapshot (an image file) of your current predictions. This is not the same as “Posting Your Predictions” (explained below). This is simply a way of posting your map image on Facebook, sending it as an attachment in an e-mail, etc. Note, that the image file will use any custom titles, candidate names, or subcategories titles that you’ve set.
Posting Your Predictions (Voting)
If you want, you can add your predictions to the Community Projection. This is a community average map that’s displayed in a separate tab. The Community Projection is not scientific, of course. To add your predictions (anonymously), open the menu in the upper right corner and select the “Post Your Predictions” option. Note that you can update your predictions at any time, but you still only get one vote. Sorry, but that’s how democracy works.